Tree Diagrams 2

Tree diagrams for dependent events are used when one event affects the next event. In without replacement questions, the total number goes down after the first pick, and the number of the colour or type picked may also change. Multiply along a path, and add paths if more than one order gives the required outcome.

Common mistake: Do not keep the second denominator the same in without replacement questions. If one item is taken from 9, there are 8 left for the second pick.

Worked example:
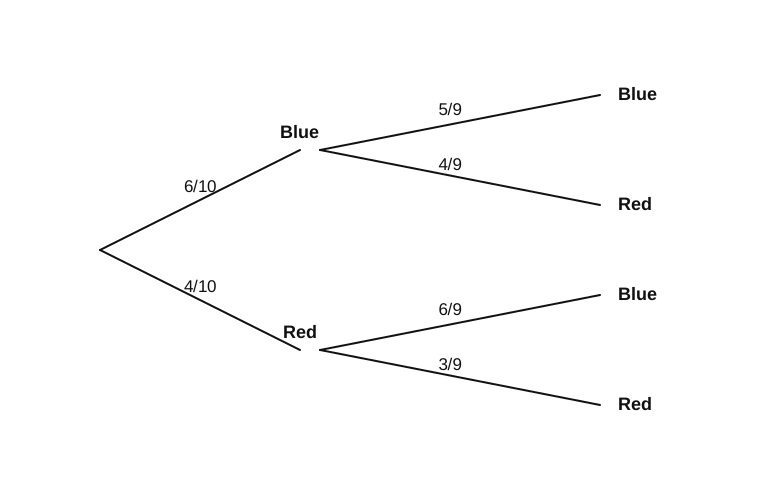
The tree diagram shows two counters chosen without replacement. Calculate the probability of blue then blue.
Dependent tree diagram for choosing two counters from a bag with 6 blue and 4 red counters.
  1. Follow the blue branch, then the blue branch again, and multiply.
    \[P(BB) = \dfrac{6}{10} \times \dfrac{5}{9} = \dfrac{30}{90} = \dfrac{1}{3}\]
Answer:
\[\dfrac{1}{3}\]
Worked example:
A bag contains 2 red counters and 7 blue counters. A counter is taken from the bag, the colour is noted and it is not put back. A second counter is then taken and the colour is noted. By drawing your own tree diagram, work out the probability that both counters taken are the same colour.
  1. Step 1
    There are 9 counters altogether. On the first pick, the probability of red is \(\dfrac{2}{9}\) and the probability of blue is \(\dfrac{7}{9}\).
  2. Step 2
    Because the counter is not replaced, the second set of branches depends on what happened first. If the first counter is red, there is 1 red and 7 blue left out of 8 counters. If the first counter is blue, there are 2 red and 6 blue left out of 8 counters.
  3. Step 3
    The counters are the same colour if they are red then red, or blue then blue.
    \[P(RR) = \dfrac{2}{9} \times \dfrac{1}{8} = \dfrac{2}{72}\]
    \[P(BB) = \dfrac{7}{9} \times \dfrac{6}{8} = \dfrac{42}{72}\]
    \[P(\text{same colour}) = \dfrac{2}{72} + \dfrac{42}{72} = \dfrac{44}{72} = \dfrac{11}{18}\]
Answer:
\[\dfrac{11}{18}\]